DFS Dashboard Analysis
April 2026 | Trump National Doral (Blue Monster), Miami, Florida
Signature Event | No-Cut Event | 72 Players | Standard DK Scoring
Event Overview
The Cadillac Championship marks the PGA Tour’s return to Trump National Doral’s Blue Monster after a 10-year absence. This Signature Event features a $20 million purse and a 72-player, no-cut field – meaning every player competes across all four rounds regardless of score. The field is headlined by world No. 1 Scottie Scheffler, two-time major champion Collin Morikawa, and recent Players Championship winner Cameron Young, though notable absences include Rory McIlroy, Xander Schauffele, Ludvig Aberg, and Matt Fitzpatrick, all of whom appear to be resting ahead of next week’s Truist Championship at Quail Hollow. Adam Scott is technically the defending champion, having won the last PGA Tour event at Doral in 2016 when it was the WGC-Cadillac Championship. DFS Dashboard ran 100,000 Monte Carlo simulations per player using the two-stage scoring model to generate all multiplier probabilities in this analysis.
No-Cut Format
Unlike most PGA Tour events, the Cadillac Championship is a no-cut event. Every player in the 72-man field is guaranteed all four rounds, which eliminates the single biggest source of DFS variance in golf – the binary cut outcome. There is no risk of a zero-point weekend from a missed cut. This fundamentally changes DFS strategy: floor becomes less important relative to ceiling, since every player will accumulate points across all four rounds. The model’s cut probability stage is not applicable here, so all analysis focuses on scoring upside and multiplier probabilities.
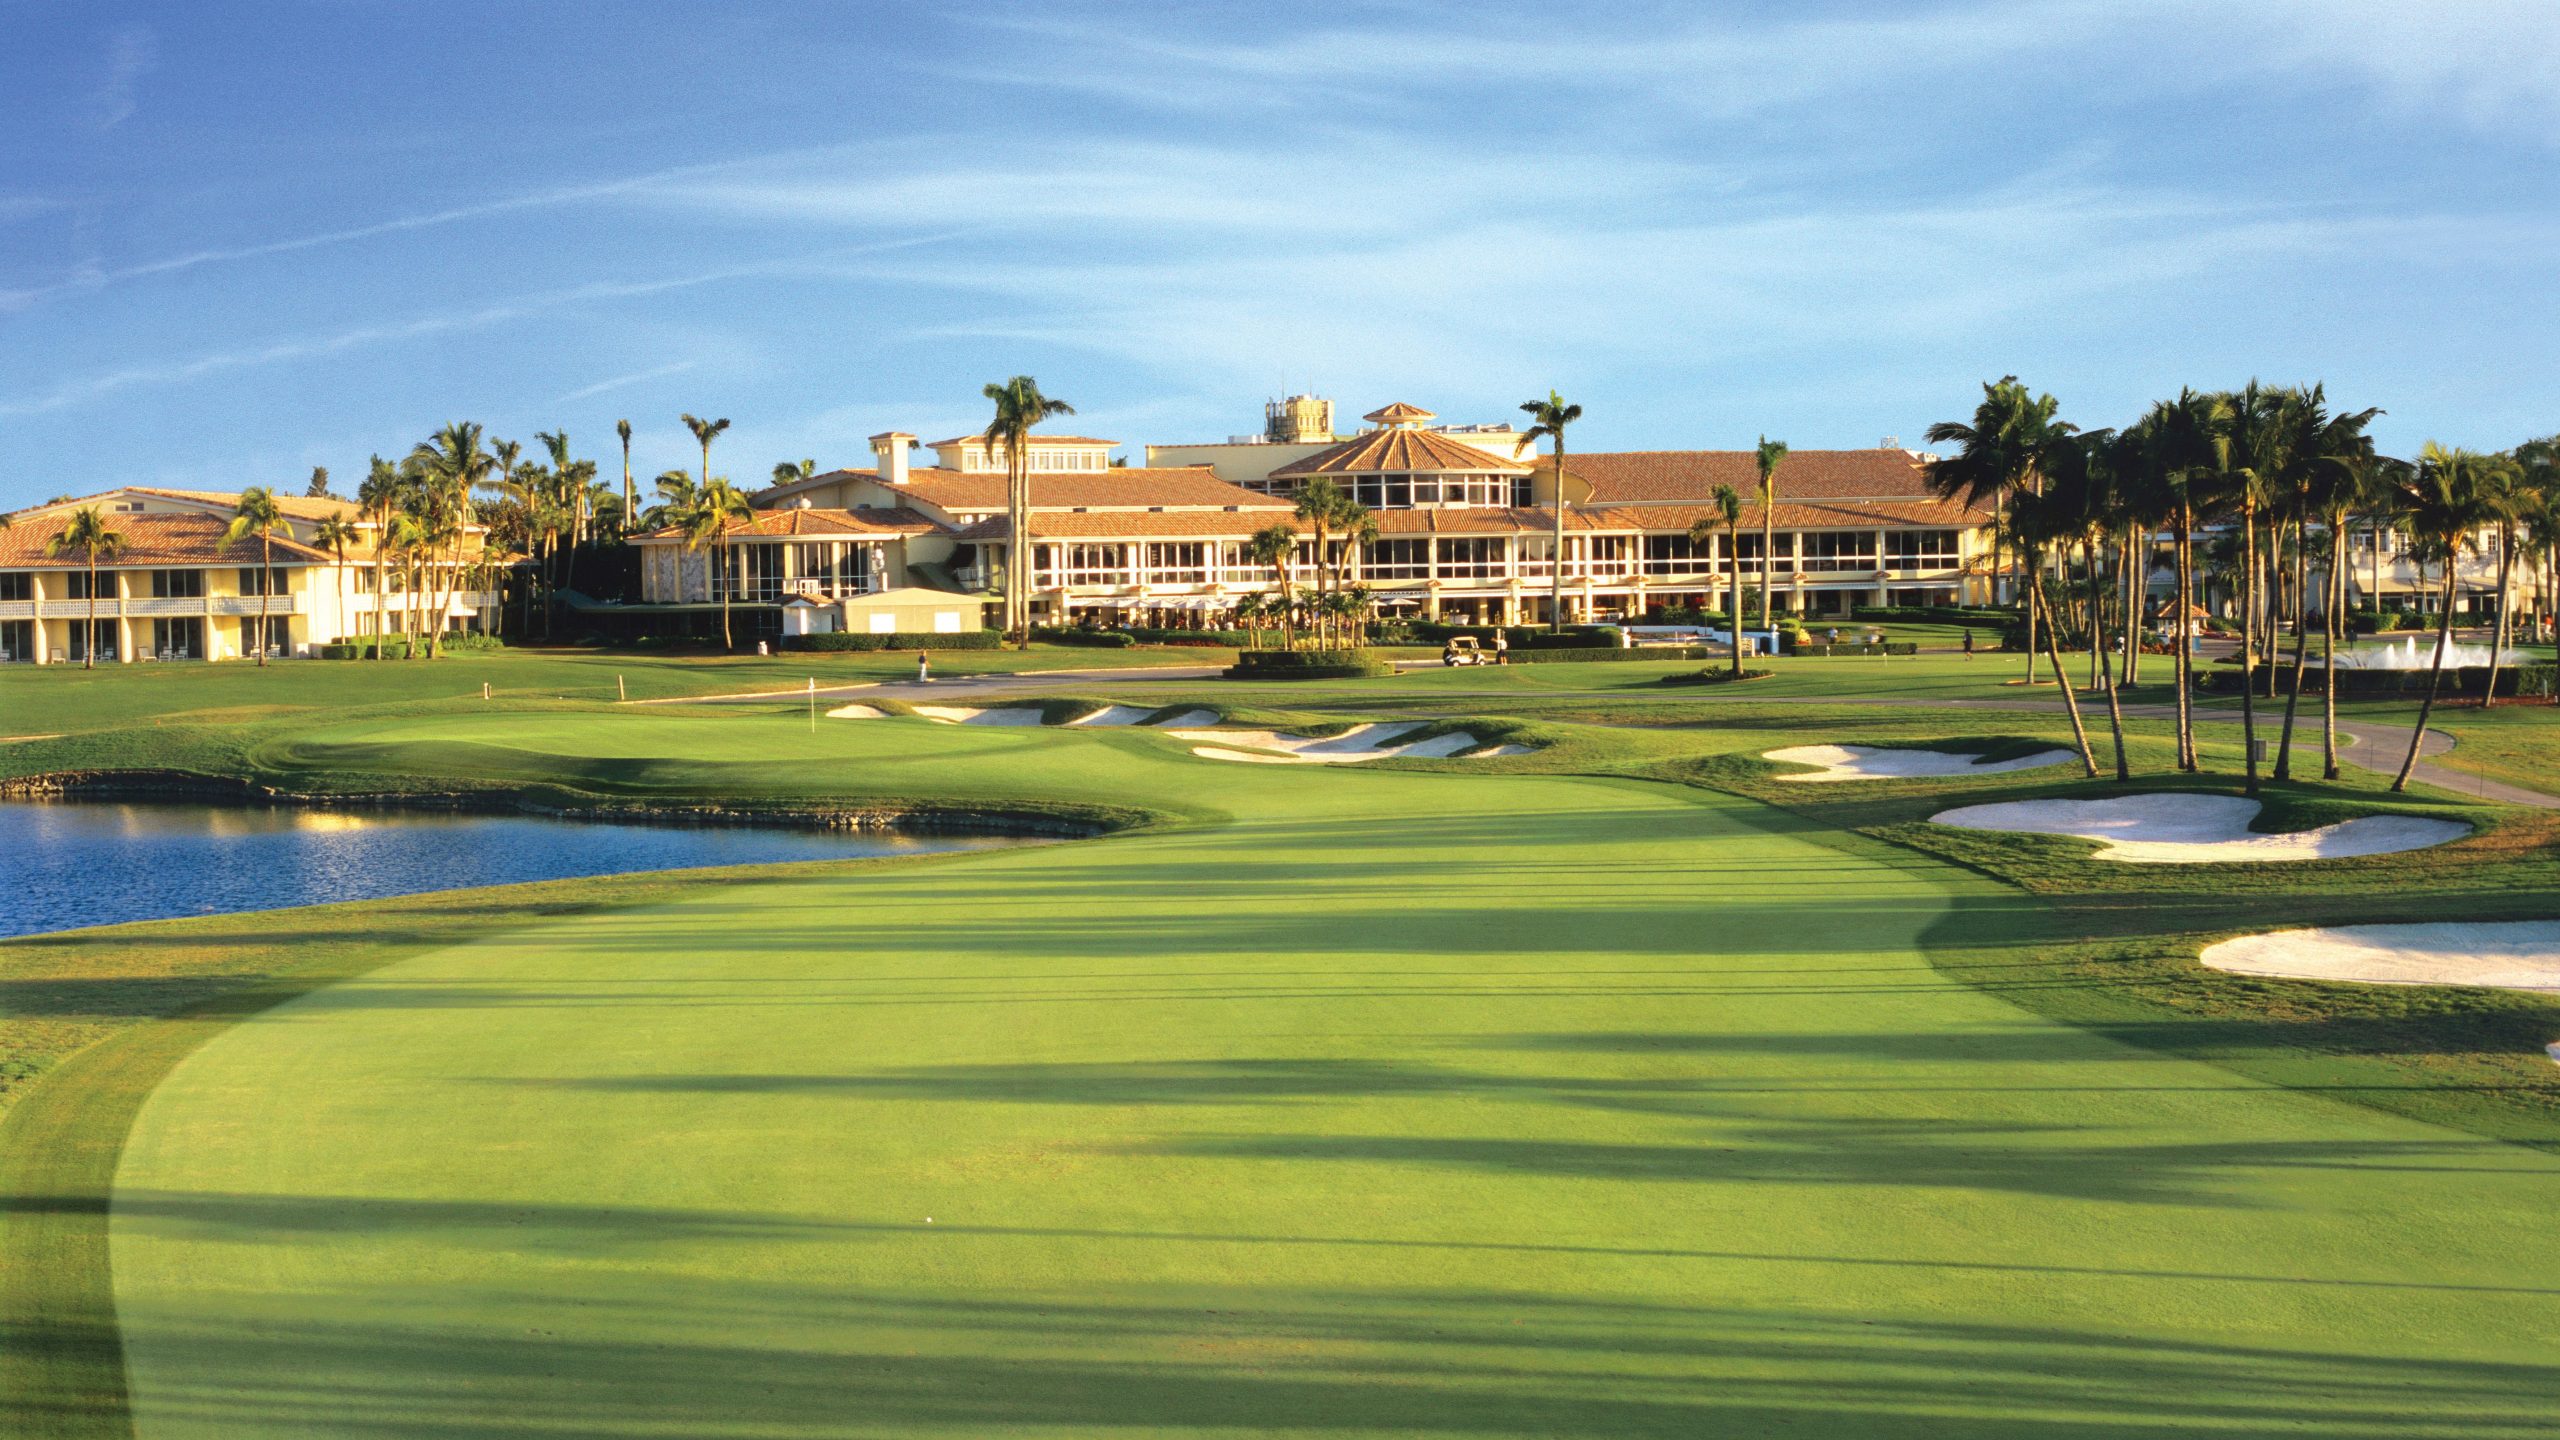
The Course
The Blue Monster at Trump National Doral is a par-72 layout stretching to 7,739 yards, making it one of the longest courses on the PGA Tour schedule. Originally designed by Dick Wilson in 1962, the course underwent a comprehensive renovation by Gil Hanse and Jim Wagner in 2014 that rebuilt every green, repositioned every bunker, and fundamentally altered the strategy on 14 of 18 holes. The most dramatic change came at the par-3 15th, which now features a peninsula green demanding a carry over water. The iconic par-4 18th – a 473-yard gauntlet with water running the full length of the left side – remains one of the most feared finishing holes in professional golf.
The course features deep, strategically placed bunkers, thick Bermuda rough, and water hazards on the majority of holes. At nearly 7,800 yards, distance off the tee is a premium skill, but the tight landing areas and undulating green complexes also reward accuracy and iron play. Players who excel in strokes gained approach and around-the-green should have an edge. South Florida wind can be a factor, and wave splits (AM vs PM) may matter depending on Thursday’s conditions. With no recent PGA Tour history at this venue to reference, course form is largely unknown territory – making simulation-based analysis particularly valuable this week.
Anchor Selection: Premium Tier ($8,300+)
With six roster spots and a $50,000 salary cap, your anchor selections from this premium tier will consume the largest share of your budget and carry the most leverage. We recommend selecting 2-3 players from this group as your lineup anchors. In a no-cut event, you can be more aggressive with premium plays since there is no risk of a zero-point weekend.
The 10X, 11X, and 12X PTS/$ columns represent the probability of a player returning 10, 11, or 12 times their salary-implied value per $1,000 – the key thresholds for GPP-winning production. For example, a $9,000 player needs 90 points to hit 10X and 108 points for 12X.
| Player | Salary | Proj Pts | 10X Pts/$ | 11X Pts/$ | 12X Pts/$ |
|---|---|---|---|---|---|
| Scottie Scheffler | $13,600 | 94.5 | 3.5% | 0.8% | 0.1% |
| Cameron Young | $10,200 | 96.1 | 40.5% | 23.6% | 12.4% |
| Russell Henley | $9,900 | 92.5 | 39.5% | 23.8% | 12.3% |
| Collin Morikawa | $9,800 | 94.1 | 44.1% | 27.9% | 15.1% |
| Tommy Fleetwood | $9,700 | 92.5 | 42.9% | 26.9% | 14.4% |
| Jake Knapp | $9,500 | 90.1 | 42.1% | 26.0% | 14.8% |
| Chris Gotterup | $9,300 | 92.6 | 50.1% | 33.0% | 19.9% |
| Si Woo Kim | $9,200 | 91.2 | 49.5% | 32.1% | 19.2% |
| Sam Burns | $9,100 | 91.9 | 52.4% | 35.3% | 21.7% |
| Hideki Matsuyama | $9,000 | 90.1 | 51.0% | 35.3% | 21.8% |
| Viktor Hovland | $8,900 | 90.0 | 52.9% | 37.0% | 23.0% |
| Maverick McNealy | $8,800 | 90.2 | 54.9% | 39.0% | 24.6% |
| Justin Rose | $8,700 | 87.1 | 51.0% | 35.3% | 21.5% |
| Min Woo Lee | $8,600 | 90.7 | 59.2% | 43.3% | 28.4% |
| Harris English | $8,500 | 87.6 | 55.6% | 39.5% | 26.6% |
| Adam Scott | $8,400 | 90.0 | 61.8% | 45.6% | 31.9% |
| Jacob Bridgeman | $8,300 | 87.7 | 59.2% | 43.0% | 29.6% |
High Floor, High Upside: Best Value Targets
After locking in your anchors, the remaining 3-4 roster spots need to balance scoring floor with tournament-winning ceiling. The 12X PTS/$ column is the critical differentiator in this group – it measures the probability of a player delivering the kind of outlier performance that wins GPPs. In a no-cut event, every player has a realistic path to four full rounds of scoring, which compresses the floor gap between tiers and makes ceiling the primary consideration.
Low-ownership players carry built-in contrarian value. Notice that Aldrich Potgieter ($6,300, 47.2% 12X probability) projects at just 1.0% ownership despite having the highest 12X rate in the entire field. At that salary, he provides enormous leverage – if he delivers, very few opponents will have him. This is the exact profile that wins large-field GPPs.
| Player | Salary | Proj Pts | Own% | 10X Pts/$ | 11X Pts/$ | 12X Pts/$ |
|---|---|---|---|---|---|---|
| Aldrich Potgieter | $6,300 | 73.9 | 1.0% | 70.5% | 58.2% | 47.2% |
| Jordan L. Smith | $6,800 | 79.4 | 1.0% | 71.0% | 59.0% | 46.0% |
| Andrew Novak | $6,500 | 74.0 | 0.8% | 67.6% | 54.9% | 43.4% |
| Ryo Hisatsune | $7,000 | 79.4 | 14.0% | 67.7% | 55.4% | 42.5% |
| Gary Woodland | $7,400 | 84.3 | 16.8% | 69.0% | 55.2% | 42.4% |
| Max Homa | $6,400 | 72.3 | 1.0% | 66.4% | 53.5% | 42.0% |
| Corey Conners | $6,900 | 77.4 | 10.0% | 66.1% | 53.6% | 40.6% |
| Ryan Gerard | $7,200 | 81.3 | 15.0% | 67.4% | 53.4% | 40.6% |
| Patrick Rodgers | $6,400 | 71.4 | 0.9% | 64.8% | 51.7% | 40.4% |
| Matthew McCarty | $6,800 | 76.3 | 0.9% | 66.2% | 53.6% | 40.4% |
| Bud Cauley | $6,600 | 73.9 | 0.8% | 65.5% | 52.7% | 39.6% |
| Max Greyserman | $6,200 | 68.8 | 0.8% | 63.7% | 50.9% | 39.3% |
| Alex Smalley | $7,100 | 79.5 | 14.0% | 66.4% | 52.0% | 39.2% |
| Sudarshan Yellamaraju | $7,000 | 77.3 | 12.9% | 64.3% | 51.6% | 38.9% |
| Keegan Bradley | $7,500 | 83.1 | 13.9% | 65.4% | 51.0% | 38.4% |
Tier Breakdown: Probability-Based Player Groupings
The tier system groups players by salary so that each tier carries approximately a 70% or greater probability that at least one player within it delivers 12X value. This is calculated as P(at least one) = 1 – Product(1 – p_i) across all players in the tier. The idea is simple: you do not need to pick the right player from a tier, you just need one of them to hit. Each tier also has a Tier Salary – the maximum individual salary in that tier – which you can use as a shorthand when estimating whether a lineup fits under the $50,000 cap.
Below are all 18 tiers for players under $8,800. Note that the final tier may fall slightly below the 70% threshold depending on how the remaining players sort.
| Player | Salary | 12X Pts/$ | Own% | Proj Pts | Wave | Tier Salary |
|---|---|---|---|---|---|---|
| TIER 1 – Tier Salary: $8,700 | 4 Players | Combined 12X Probability: 71.9% | ||||||
| Justin Rose | $8,700 | 21.5% | 9.2% | 87.1 | AM | $8,700 |
| Min Woo Lee | $8,600 | 28.4% | 10.6% | 90.7 | AM | $8,700 |
| Harris English | $8,500 | 26.6% | 9.4% | 87.6 | AM | $8,700 |
| Adam Scott | $8,400 | 31.9% | 10.0% | 90.0 | AM | $8,700 |
| TIER 2 – Tier Salary: $8,300 | 4 Players | Combined 12X Probability: 76.1% | ||||||
| Jacob Bridgeman | $8,300 | 29.6% | 10.0% | 87.7 | AM | $8,300 |
| Jordan Spieth | $8,200 | 27.9% | 10.0% | 85.6 | AM | $8,300 |
| Michael Thorbjornsen | $8,200 | 33.2% | -0.0% | 88.9 | PM | $8,300 |
| Akshay Bhatia | $8,100 | 29.6% | 10.0% | 85.8 | AM | $8,300 |
| TIER 3 – Tier Salary: $8,000 | 4 Players | Combined 12X Probability: 78.8% | ||||||
| Rickie Fowler | $8,000 | 32.1% | 10.0% | 85.3 | PM | $8,000 |
| Ben Griffin | $8,000 | 30.3% | 0.0% | 84.3 | AM | $8,000 |
| Sepp Straka | $7,900 | 32.1% | 14.5% | 84.3 | AM | $8,000 |
| Kurt Kitayama | $7,900 | 34.0% | 15.1% | 85.4 | AM | $8,000 |
| TIER 4 – Tier Salary: $7,800 | 3 Players | Combined 12X Probability: 71.8% | ||||||
| J.J. Spaun | $7,800 | 33.9% | 14.5% | 84.3 | AM | $7,800 |
| Nicolai Hojgaard | $7,800 | 35.9% | 15.2% | 85.6 | PM | $7,800 |
| Jason Day | $7,700 | 33.4% | 13.9% | 83.1 | PM | $7,800 |
| TIER 5 – Tier Salary: $7,700 | 4 Players | Combined 12X Probability: 81.2% | ||||||
| Justin Thomas | $7,700 | 31.1% | 13.2% | 81.7 | AM | $7,700 |
| Sahith Theegala | $7,600 | 31.9% | 13.0% | 81.3 | AM | $7,700 |
| Shane Lowry | $7,600 | 34.9% | 13.9% | 83.2 | PM | $7,700 |
| Keegan Bradley | $7,500 | 38.4% | 13.9% | 83.1 | PM | $7,700 |
| TIER 6 – Tier Salary: $7,500 | 3 Players | Combined 12X Probability: 73.2% | ||||||
| Keith Mitchell | $7,500 | 34.0% | 12.6% | 80.6 | AM | $7,500 |
| Gary Woodland | $7,400 | 42.4% | 16.8% | 84.3 | AM | $7,500 |
| Harry Hall | $7,400 | 29.7% | 12.7% | 77.0 | AM | $7,500 |
| TIER 7 – Tier Salary: $7,300 | 3 Players | Combined 12X Probability: 73.8% | ||||||
| Sam Stevens | $7,300 | 36.8% | 14.4% | 80.3 | PM | $7,300 |
| Pierceson Coody | $7,300 | 37.5% | 14.6% | 80.6 | AM | $7,300 |
| Alex Noren | $7,200 | 33.6% | 12.9% | 77.4 | PM | $7,300 |
| TIER 8 – Tier Salary: $7,200 | 3 Players | Combined 12X Probability: 76.6% | ||||||
| Ryan Gerard | $7,200 | 40.6% | 15.0% | 81.3 | PM | $7,200 |
| Daniel Berger | $7,100 | 35.2% | 12.9% | 77.4 | PM | $7,200 |
| Alex Smalley | $7,100 | 39.2% | 14.0% | 79.5 | AM | $7,200 |
| TIER 9 – Tier Salary: $7,000 | 3 Players | Combined 12X Probability: 79.1% | ||||||
| Ryo Hisatsune | $7,000 | 42.5% | 14.0% | 79.4 | AM | $7,000 |
| Sudarshan Yellamaraju | $7,000 | 38.9% | 12.9% | 77.3 | AM | $7,000 |
| Corey Conners | $6,900 | 40.6% | 10.0% | 77.4 | PM | $7,000 |
| TIER 10 – Tier Salary: $6,900 | 3 Players | Combined 12X Probability: 74.0% | ||||||
| Ricky Castillo | $6,900 | 36.1% | 0.8% | 74.9 | AM | $6,900 |
| Nick Taylor | $6,900 | 31.7% | 0.7% | 72.5 | PM | $6,900 |
| Matthew McCarty | $6,800 | 40.4% | 0.9% | 76.3 | AM | $6,900 |
| TIER 11 – Tier Salary: $6,800 | 3 Players | Combined 12X Probability: 77.5% | ||||||
| Ryan Fox | $6,800 | 35.8% | 0.8% | 73.8 | PM | $6,800 |
| Jordan L. Smith | $6,800 | 46.0% | 1.0% | 79.4 | AM | $6,800 |
| Sungjae Im | $6,700 | 35.0% | 0.7% | 72.5 | AM | $6,800 |
| TIER 12 – Tier Salary: $6,700 | 3 Players | Combined 12X Probability: 73.7% | ||||||
| Taylor Pendrith | $6,700 | 35.1% | 0.7% | 72.4 | AM | $6,700 |
| Alex Fitzpatrick | $6,700 | 37.9% | 0.8% | 74.0 | PM | $6,700 |
| Matt Wallace | $6,600 | 34.9% | 0.7% | 71.4 | AM | $6,700 |
| TIER 13 – Tier Salary: $6,600 | 3 Players | Combined 12X Probability: 75.9% | ||||||
| Bud Cauley | $6,600 | 39.6% | 0.8% | 73.9 | AM | $6,600 |
| Brian Harman | $6,600 | 36.4% | 10.0% | 72.3 | AM | $6,600 |
| Michael Kim | $6,500 | 37.4% | 0.7% | 70.7 | PM | $6,600 |
| TIER 14 – Tier Salary: $6,500 | 3 Players | Combined 12X Probability: 79.4% | ||||||
| Andrew Novak | $6,500 | 43.4% | 0.8% | 74.0 | PM | $6,500 |
| J.T. Poston | $6,500 | 37.2% | 0.7% | 70.7 | PM | $6,500 |
| Max Homa | $6,400 | 42.0% | 1.0% | 72.3 | PM | $6,500 |
| TIER 15 – Tier Salary: $6,400 | 3 Players | Combined 12X Probability: 72.2% | ||||||
| Patrick Rodgers | $6,400 | 40.4% | 0.9% | 71.4 | AM | $6,400 |
| Denny McCarthy | $6,400 | 33.8% | 0.8% | 67.9 | AM | $6,400 |
| Andrew Putnam | $6,300 | 29.6% | 0.7% | 64.6 | AM | $6,400 |
| TIER 16 – Tier Salary: $6,300 | 3 Players | Combined 12X Probability: 74.5% | ||||||
| Austin Smotherman | $6,300 | 35.4% | 0.8% | 67.8 | PM | $6,300 |
| Aldrich Potgieter | $6,300 | 47.2% | 1.0% | 73.9 | PM | $6,300 |
| Jhonattan Vegas | $6,200 | 25.4% | 0.5% | 61.2 | AM | $6,300 |
| TIER 17 – Tier Salary: $6,200 | 4 Players | Combined 12X Probability: 77.6% | ||||||
| Nicolas Echavarria | $6,200 | 25.2% | 0.5% | 61.1 | PM | $6,200 |
| Max Greyserman | $6,200 | 39.3% | 0.8% | 68.8 | PM | $6,200 |
| Chandler Blanchet | $6,100 | 32.7% | 0.7% | 64.4 | PM | $6,200 |
| Tom Hoge | $6,100 | 26.8% | 0.5% | 61.2 | AM | $6,200 |
| TIER 18 – Tier Salary: $6,100 | 4 Players | Combined 12X Probability: 71.9% | ||||||
| Joel Dahmen | $6,100 | 30.9% | 0.6% | 63.3 | AM | $6,100 |
| David Lipsky | $6,000 | 28.5% | 0.5% | 60.2 | AM | $6,100 |
| Brian Campbell | $6,000 | 20.4% | 0.3% | 55.2 | PM | $6,100 |
| Lucas Glover | $6,000 | 28.7% | 0.5% | 60.3 | PM | $6,100 |
Building Your GPP Lineups
For a no-cut Signature Event, we recommend building 3-4 distinct lineups to diversify anchor exposure and tier assignments. Each lineup should follow the same systematic approach: select 2-3 anchors from the premium tier, then fill the remaining spots with exactly one player from each of 4 distinct tiers. Use the Tier Salary to estimate whether your selections fit within the $50,000 cap before finalizing specific player picks.
How to Construct Each Lineup
Start by selecting 2 anchors from the Premium Tier ($8,300+). Calculate your remaining salary. Then choose 4 tiers whose Tier Salaries fit within the remaining budget. Each tier should be used only once per lineup. Finally, pick one player from each tier column to complete the build.
Example Lineup
Anchors: Collin Morikawa ($9,800) + Sam Burns ($9,100) = $18,900 in anchors. Remaining salary: $31,100. Selected tiers: Tier 2 ($8,300) + Tier 5 ($7,700) + Tier 7 ($7,300) + Tier 11 ($6,800) = $30,100 in tier salaries. Estimated total: $49,000.
| P1 Anchor | P2 Anchor | Tier 2 | Tier 5 | Tier 7 | Tier 11 |
|---|---|---|---|---|---|
| Collin Morikawa $9,800 |
Sam Burns $9,100 |
Jacob Bridgeman ($8,300) Jordan Spieth ($8,200) Michael Thorbjornsen ($8,200) Akshay Bhatia ($8,100) |
Justin Thomas ($7,700) Sahith Theegala ($7,600) Shane Lowry ($7,600) Keegan Bradley ($7,500) |
Sam Stevens ($7,300) Pierceson Coody ($7,300) Alex Noren ($7,200) |
Ryan Fox ($6,800) Jordan L. Smith ($6,800) Sungjae Im ($6,700) |
Select one player from each tier column. For example: Collin Morikawa + Sam Burns + Michael Thorbjornsen ($8,200) + Keegan Bradley ($7,500) + Sam Stevens ($7,300) + Jordan L. Smith ($6,800) = $48,700. You have $1,300 remaining to upgrade one tier pick to a higher-salaried option within that same tier, such as swapping Stevens for Pierceson Coody (same salary) or upgrading Smith to Ryan Fox ($6,800).
Cash Game Strategy: High-Ownership Core Lineup
In cash games (50/50s and double-ups), the goal is consistency – you want the most likely path to finishing in the top half of the field. In a no-cut event, this means stacking the highest-owned, highest-projected players without worrying about cut risk. High ownership is a feature in cash, not a liability – if the chalk hits, everyone wins, and that is exactly what you want in a format where you only need to beat half the field.
The core lineup below was built by optimizing for maximum combined projected ownership under the $49,000-$50,000 salary constraint. The six selected players combine for 99.8% total ownership on $50,000 in salary: Chris Gotterup, Si Woo Kim, Sam Burns, Nicolai Hojgaard, Gary Woodland, Ryan Gerard.
| Player | Salary | Own% | Proj Pts | 12X Pts/$ | Wave | Core |
|---|---|---|---|---|---|---|
| Chris Gotterup | $9,300 | 18.1% | 92.6 | 19.9% | PM | ✓ |
| Scottie Scheffler | $13,600 | 17.9% | 94.5 | 0.1% | AM | |
| Sam Burns | $9,100 | 17.7% | 91.9 | 21.7% | PM | ✓ |
| Si Woo Kim | $9,200 | 17.1% | 91.2 | 19.2% | PM | ✓ |
| Gary Woodland | $7,400 | 16.8% | 84.3 | 42.4% | AM | ✓ |
| Hideki Matsuyama | $9,000 | 16.3% | 90.1 | 21.8% | PM | |
| Nicolai Hojgaard | $7,800 | 15.2% | 85.6 | 35.9% | PM | ✓ |
| Kurt Kitayama | $7,900 | 15.1% | 85.4 | 34.0% | AM | |
| Ryan Gerard | $7,200 | 15.0% | 81.3 | 40.6% | PM | ✓ |
| Pierceson Coody | $7,300 | 14.6% | 80.6 | 37.5% | AM | |
| Sepp Straka | $7,900 | 14.5% | 84.3 | 32.1% | AM | |
| J.J. Spaun | $7,800 | 14.5% | 84.3 | 33.9% | AM | |
| Sam Stevens | $7,300 | 14.4% | 80.3 | 36.8% | PM | |
| Alex Smalley | $7,100 | 14.0% | 79.5 | 39.2% | AM | |
| Ryo Hisatsune | $7,000 | 14.0% | 79.4 | 42.5% | AM | |
| Keegan Bradley | $7,500 | 13.9% | 83.1 | 38.4% | PM | |
| Shane Lowry | $7,600 | 13.9% | 83.2 | 34.9% | PM | |
| Jason Day | $7,700 | 13.9% | 83.1 | 33.4% | PM | |
| Cameron Young | $10,200 | 13.8% | 96.1 | 12.4% | AM | |
| Justin Thomas | $7,700 | 13.2% | 81.7 | 31.1% | AM | |
| Sahith Theegala | $7,600 | 13.0% | 81.3 | 31.9% | AM | |
| Sudarshan Yellamaraju | $7,000 | 12.9% | 77.3 | 38.9% | AM | |
| Daniel Berger | $7,100 | 12.9% | 77.4 | 35.2% | PM | |
| Alex Noren | $7,200 | 12.9% | 77.4 | 33.6% | PM | |
| Harry Hall | $7,400 | 12.7% | 77.0 | 29.7% | AM |