DFS Dashboard Analysis
April 2026 | Augusta National Golf Club, Augusta, Georgia
Invitational Event | Cut Event (Top 50 & Ties + Within 10 Strokes) | Standard DK Scoring
Event Overview
The 90th playing of the Masters Tournament returns to Augusta National Golf Club for the first major championship of the 2026 season. The purse is expected to be approximately $22 million (official confirmation pending from Augusta National during tournament week), with the winner projected to earn roughly $4.4 million along with 750 FedExCup points and 100 Official World Golf Ranking points. Defending champion Rory McIlroy returns seeking back-to-back green jackets after his emotional playoff victory over Justin Rose last year, which completed the career Grand Slam. World No. 1 Scottie Scheffler leads the 88-player invitational field as the betting favorite, seeking his third Masters title (2022, 2024) which would tie Gary Player, Sam Snead, and Nick Faldo. The field also features Ludvig Aberg, Xander Schauffele, Jon Rahm (eligible through his 2023 victory), Collin Morikawa, Brooks Koepka, and Bryson DeChambeau. The only confirmed course change for 2026 is the 17th hole, lengthened by 10 yards to 450 yards. DFS Dashboard ran simulations using the two-stage bimodal mixture model to produce the projections and probability distributions analyzed in this article.
Cut Rules
The Masters employs a unique cut rule: the top 50 players and ties after 36 holes advance to the weekend, along with any player within 10 strokes of the 36-hole leader. This is more generous than the standard PGA Tour top-65-and-ties format, and historically allows a larger number of players to compete on the weekend. Players who miss the cut receive $25,000 (increased from $10,000 as of 2025) but zero DraftKings points for weekend rounds. With only 88 players in the field compared to typical 132-144 player full-field events, the cut probability distribution is wider – many elite players carry very high cut probabilities while the field’s tail drops off sharply. The model applies a hard 50% cut probability floor before lineup building, which eliminated 23 players from the active pool, leaving 70 eligible players for this analysis.
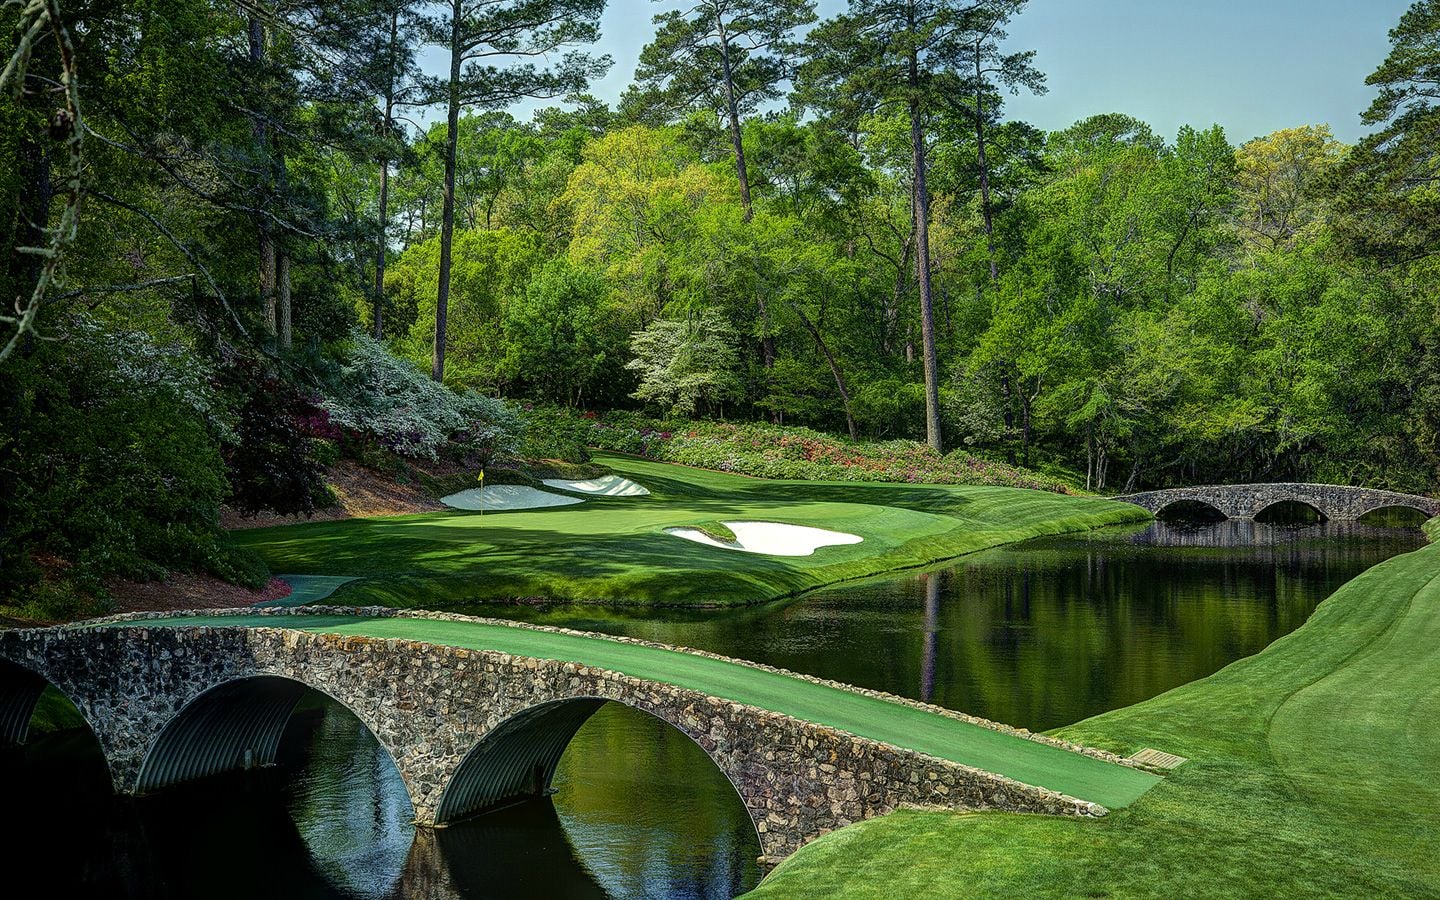
The Course
Augusta National Golf Club is a par-72 layout measuring 7,565 yards, originally designed by Alister MacKenzie and Bobby Jones on the site of a former nursery and antebellum plantation called Fruitland. The course opened for play in 1932 and has been the permanent home of the Masters since 1934. Augusta National has undergone multiple renovations and lengthenings over the decades, with contributions from Perry Maxwell, Robert Trent Jones Sr., and others. The course features dramatic elevation changes far beyond what television conveys, with the famous downhill plunge at the 10th hole and the roller-coaster terrain through Amen Corner (holes 11, 12, and 13). Greens are bentgrass, maintained at Stimpmeter readings widely reported to exceed 13 during competition, making them among the fastest and most contoured surfaces in professional golf.
Augusta National demands a specific skill set: length off the tee (the course plays longer than its stated yardage), the ability to hit high, soft approach shots that hold the firm greens, and exceptional course management around the green complexes. Every Masters winner since 2010 has entered ranked in the top 30 of the OWGR, and 90% of top-10 finishers since 2017 ranked inside the top 95 in strokes gained tee-to-green. Putting is notoriously difficult for everyone on these greens, which tends to neutralize putting advantages – notably, Scheffler (2024), Matsuyama (2021), and Garcia (2017) all won while ranked outside the top 95 in SG putting. The four par 5s are critical birdie opportunities, and course history matters significantly: 73% of recent top-10 finishers had a prior top-10 at Augusta.
Anchor Selection: Premium Tier ($8,300+)
Your anchor selections are the highest-leverage picks in DFS lineup construction, consuming the largest share of your salary cap. We recommend selecting 2-3 anchor players from this premium tier to form the backbone of each lineup. At the Masters, the premium tier is exceptionally deep due to the elite field, making anchor selection both critical and challenging. Note that Scheffler’s $14,000 salary creates a unique constraint – pairing him with another premium anchor significantly limits remaining salary.
The 10X, 11X, and 12X PTS/$ columns represent the probability that each player returns 10, 11, or 12 times their salary-implied fantasy point value. These multiplier probabilities capture upside beyond raw projected points and are essential for GPP lineup differentiation.
| Player | Salary | Proj Pts | Cut Prob | 10X Pts/$ | 11X Pts/$ | 12X Pts/$ |
|---|---|---|---|---|---|---|
| Scottie Scheffler | $14,000 | 102.0 | 95% | 5.14% | 1.31% | 0.22% |
| Rory McIlroy | $11,600 | 95.0 | 84% | 18.97% | 8.05% | 2.65% |
| Bryson DeChambeau | $10,200 | 96.0 | 85% | 40.32% | 23.31% | 12.05% |
| Jon Rahm | $10,000 | 99.0 | 95% | 48.52% | 31.79% | 18.19% |
| Ludvig Aberg | $9,800 | 91.0 | 78% | 39.01% | 23.51% | 12.09% |
| Xander Schauffele | $9,600 | 94.0 | 82% | 47.85% | 31.04% | 17.64% |
| Collin Morikawa | $9,500 | 89.0 | 75% | 40.00% | 24.07% | 13.43% |
| Tommy Fleetwood | $9,300 | 92.0 | 80% | 49.82% | 32.86% | 19.82% |
| Cameron Young | $9,200 | 90.0 | 77% | 47.91% | 30.89% | 18.30% |
| Justin Rose | $9,100 | 84.0 | 75% | 38.90% | 22.94% | 12.48% |
| Patrick Reed | $9,000 | 84.0 | 75% | 40.05% | 25.17% | 13.99% |
| Hideki Matsuyama | $8,900 | 90.0 | 77% | 52.69% | 36.93% | 22.96% |
| Viktor Hovland | $8,800 | 82.0 | 75% | 40.75% | 25.81% | 14.49% |
| Matt Fitzpatrick | $8,700 | 91.0 | 78% | 58.08% | 42.42% | 27.71% |
| Robert MacIntyre | $8,600 | 87.0 | 75% | 52.84% | 36.95% | 23.03% |
| Brooks Koepka | $8,500 | 83.0 | 75% | 46.59% | 31.04% | 19.54% |
| Jordan Spieth | $8,400 | 84.0 | 75% | 51.68% | 35.45% | 22.97% |
| Justin Thomas | $8,300 | 79.0 | 75% | 44.05% | 28.41% | 17.34% |
High Floor, High Upside: Best Value Targets
After locking in your anchors, the remaining roster spots demand a careful balance between floor and ceiling. This is where the 12X PTS/$ column becomes your primary guide. At the Masters, value targets carry additional risk due to the elite field and demanding course, but the payoff for finding a low-owned player who contends is enormous in GPP formats.
Low-ownership players in this tier carry built-in contrarian value. In large GPP fields, differentiation is the key to climbing leaderboards. Consider Kurt Kitayama at $6,800 with a 43.19% chance of hitting 12X – that is outsized upside relative to salary cost and ownership of just 4.41%.
| Player | Salary | Proj Pts | Cut % | Own% | 10X Pts/$ | 11X Pts/$ | 12X Pts/$ |
|---|---|---|---|---|---|---|---|
| Kurt Kitayama | $6,800 | 78.0 | 75% | 4.41% | 68.38% | 56.18% | 43.19% |
| Sam Stevens | $6,400 | 72.0 | 58% | 3.73% | 65.42% | 52.35% | 40.86% |
| Adam Scott | $7,200 | 81.0 | 75% | 5.93% | 67.76% | 53.64% | 40.79% |
| Min Woo Lee | $7,700 | 87.0 | 75% | 15.62% | 68.43% | 54.64% | 40.06% |
| Nick Taylor | $6,500 | 72.0 | 58% | 0.20% | 63.40% | 50.37% | 39.18% |
| Kristoffer Reitan | $6,300 | 68.0 | 58% | 0.64% | 61.22% | 48.05% | 36.69% |
| Maverick McNealy | $7,200 | 79.0 | 75% | 6.51% | 63.46% | 48.94% | 36.26% |
| J.J. Spaun | $7,200 | 79.0 | 75% | 3.79% | 63.27% | 48.74% | 35.84% |
| Brian Harman | $6,500 | 70.0 | 58% | 2.02% | 60.04% | 46.79% | 35.61% |
| Si Woo Kim | $7,800 | 85.0 | 75% | 11.06% | 63.34% | 49.00% | 35.05% |
| Russell Henley | $7,900 | 86.0 | 75% | 15.17% | 63.31% | 49.01% | 34.86% |
| Ryan Gerard | $6,800 | 73.0 | 58% | 11.96% | 60.54% | 47.42% | 34.61% |
| Rasmus Hojgaard | $6,900 | 74.0 | 58% | 5.24% | 59.69% | 46.62% | 33.72% |
| Hao-Tong Li | $6,300 | 67.0 | 58% | 4.43% | 58.38% | 44.87% | 33.63% |
| Sam Burns | $7,400 | 79.0 | 75% | 4.37% | 60.63% | 45.69% | 33.22% |
Tier Breakdown: Probability-Based Player Groupings
The tier system groups players by salary into bands where the combined probability of at least one player delivering a 12X return reaches approximately 70%. This is calculated using the formula: P(at least one) = 1 – Product(1 – p_i) for all players i in the tier. Each tier gives you roughly a 70%+ chance that at least one player within it will hit a tournament-winning return.
Tier Salary represents the maximum individual salary within each tier and is used for quick salary fitting when constructing lineups. With 14 tiers available due to the deep Masters field, there is significant flexibility in constructing salary-compliant lineups.
| Player | Salary | 12X Pts/$ | Cut % | Own% | Proj Pts | Wave | Tier Salary |
|---|---|---|---|---|---|---|---|
| TIER 1 – Tier Salary: $8,700 | 5 Players | Combined 12X Probability: 71.5% | |||||||
| Matt Fitzpatrick | $8,700 | 27.71% | 78% | 14.70% | 91.0 | AM | $8,700 |
| Robert MacIntyre | $8,600 | 23.03% | 75% | 11.97% | 87.0 | PM | $8,700 |
| Brooks Koepka | $8,500 | 19.54% | 75% | 13.96% | 83.0 | PM | $8,700 |
| Jordan Spieth | $8,400 | 22.97% | 75% | 13.32% | 84.0 | PM | $8,700 |
| Justin Thomas | $8,300 | 17.34% | 75% | 9.41% | 79.0 | PM | $8,700 |
| TIER 2 – Tier Salary: $8,200 | 5 Players | Combined 12X Probability: 76.4% | |||||||
| Shane Lowry | $8,200 | 21.31% | 75% | 11.99% | 81.0 | AM | $8,200 |
| Tyrrell Hatton | $8,100 | 18.11% | 75% | 11.37% | 78.0 | AM | $8,200 |
| Sepp Straka | $8,000 | 22.49% | 75% | 16.71% | 79.0 | PM | $8,200 |
| Chris Gotterup | $8,000 | 27.56% | 75% | 17.23% | 83.0 | PM | $8,200 |
| Russell Henley | $7,900 | 34.86% | 75% | 15.17% | 86.0 | AM | $8,200 |
| TIER 3 – Tier Salary: $7,900 | 4 Players | Combined 12X Probability: 80.0% | |||||||
| Patrick Cantlay | $7,900 | 27.42% | 75% | 5.26% | 81.0 | AM | $7,900 |
| Akshay Bhatia | $7,800 | 29.24% | 75% | 11.35% | 82.0 | AM | $7,900 |
| Si Woo Kim | $7,800 | 35.05% | 75% | 11.06% | 85.0 | PM | $7,900 |
| Min Woo Lee | $7,700 | 40.06% | 75% | 15.62% | 87.0 | AM | $7,900 |
| TIER 4 – Tier Salary: $7,700 | 4 Players | Combined 12X Probability: 70.8% | |||||||
| Corey Conners | $7,700 | 25.48% | 75% | 10.49% | 78.0 | AM | $7,700 |
| Jason Day | $7,600 | 31.62% | 75% | 4.17% | 81.0 | AM | $7,700 |
| Ben Griffin | $7,600 | 23.64% | 75% | 0.81% | 76.0 | PM | $7,700 |
| Sungjae Im | $7,500 | 24.93% | 75% | 7.96% | 75.0 | AM | $7,700 |
| TIER 5 – Tier Salary: $7,500 | 4 Players | Combined 12X Probability: 75.7% | |||||||
| Nicolai Hojgaard | $7,500 | 30.42% | 75% | 15.81% | 78.0 | AM | $7,500 |
| Cameron Smith | $7,500 | 23.37% | 58% | 8.09% | 74.0 | AM | $7,500 |
| Jake Knapp | $7,400 | 33.09% | 75% | 13.42% | 79.0 | AM | $7,500 |
| Jacob Bridgeman | $7,400 | 31.85% | 75% | 10.37% | 78.0 | AM | $7,500 |
| TIER 6 – Tier Salary: $7,400 | 5 Players | Combined 12X Probability: 79.3% | |||||||
| Sam Burns | $7,400 | 33.22% | 75% | 4.37% | 79.0 | AM | $7,400 |
| Marco Penge | $7,300 | 21.41% | 58% | 3.37% | 71.0 | PM | $7,400 |
| Gary Woodland | $7,300 | 25.38% | 58% | 5.01% | 73.0 | PM | $7,400 |
| Max Homa | $7,300 | 23.18% | 58% | 4.85% | 72.0 | AM | $7,400 |
| Harris English | $7,300 | 31.16% | 75% | 1.51% | 77.0 | PM | $7,400 |
| TIER 7 – Tier Salary: $7,200 | 3 Players | Combined 12X Probability: 75.8% | |||||||
| Adam Scott | $7,200 | 40.79% | 75% | 5.93% | 81.0 | AM | $7,200 |
| J.J. Spaun | $7,200 | 35.84% | 75% | 3.79% | 79.0 | AM | $7,200 |
| Maverick McNealy | $7,200 | 36.26% | 75% | 6.51% | 79.0 | AM | $7,200 |
| TIER 8 – Tier Salary: $7,100 | 5 Players | Combined 12X Probability: 75.1% | |||||||
| Ryan Fox | $7,100 | 21.63% | 58% | 9.16% | 69.0 | AM | $7,100 |
| Daniel Berger | $7,100 | 31.43% | 75% | 5.34% | 75.0 | AM | $7,100 |
| Sergio Garcia | $7,100 | 19.27% | 58% | 4.38% | 68.0 | AM | $7,100 |
| Wyndham Clark | $7,100 | 17.57% | 58% | 3.91% | 67.0 | AM | $7,100 |
| Alex Noren | $7,000 | 30.35% | 58% | 2.89% | 73.0 | AM | $7,100 |
| TIER 9 – Tier Salary: $7,000 | 4 Players | Combined 12X Probability: 75.2% | |||||||
| Keegan Bradley | $7,000 | 30.68% | 58% | 2.28% | 73.0 | AM | $7,000 |
| Dustin Johnson | $7,000 | 21.23% | 58% | 4.52% | 67.0 | AM | $7,000 |
| Rasmus Hojgaard | $6,900 | 33.72% | 58% | 5.24% | 74.0 | AM | $7,000 |
| Harry Hall | $6,900 | 31.37% | 58% | 2.19% | 72.0 | AM | $7,000 |
| TIER 10 – Tier Salary: $6,900 | 4 Players | Combined 12X Probability: 78.6% | |||||||
| Tom McKibbin | $6,900 | 22.55% | 58% | 4.52% | 67.0 | AM | $6,900 |
| Kurt Kitayama | $6,800 | 43.19% | 75% | 4.41% | 78.0 | AM | $6,900 |
| Aaron Rai | $6,800 | 25.49% | 58% | 3.07% | 68.0 | AM | $6,900 |
| Ryan Gerard | $6,800 | 34.61% | 58% | 11.96% | 73.0 | AM | $6,900 |
| TIER 11 – Tier Salary: $6,700 | 4 Players | Combined 12X Probability: 70.3% | |||||||
| Nicolas Echavarria | $6,700 | 23.23% | 58% | 1.90% | 66.0 | AM | $6,700 |
| Michael Kim | $6,700 | 28.96% | 58% | 2.14% | 69.0 | AM | $6,700 |
| Rasmus Neergaard-Petersen | $6,700 | 23.75% | 58% | 0.20% | 66.0 | AM | $6,700 |
| Carlos Ortiz | $6,600 | 28.57% | 58% | 2.22% | 68.0 | AM | $6,700 |
| TIER 12 – Tier Salary: $6,600 | 4 Players | Combined 12X Probability: 76.9% | |||||||
| Max Greyserman | $6,600 | 29.57% | 58% | 0.20% | 68.0 | AM | $6,600 |
| Casey Jarvis | $6,600 | 30.00% | 58% | 2.28% | 69.0 | AM | $6,600 |
| Brian Harman | $6,500 | 35.61% | 58% | 2.02% | 70.0 | AM | $6,600 |
| Sami Valimaki | $6,500 | 27.27% | 58% | 2.75% | 65.0 | AM | $6,600 |
| TIER 13 – Tier Salary: $6,500 | 3 Players | Combined 12X Probability: 75.2% | |||||||
| Nick Taylor | $6,500 | 39.18% | 58% | 0.20% | 72.0 | AM | $6,500 |
| Matthew McCarty | $6,500 | 30.94% | 58% | 1.38% | 67.0 | AM | $6,500 |
| Sam Stevens | $6,400 | 40.86% | 58% | 3.73% | 72.0 | AM | $6,500 |
| TIER 14 – Tier Salary: $6,400 | 3 Players | Combined 12X Probability: 71.1% | |||||||
| Andrew Novak | $6,400 | 31.31% | 58% | 1.84% | 67.0 | AM | $6,400 |
| Kristoffer Reitan | $6,300 | 36.69% | 58% | 0.64% | 68.0 | AM | $6,400 |
| Hao-Tong Li | $6,300 | 33.63% | 58% | 4.43% | 67.0 | AM | $6,400 |
Building Your GPP Lineups
For optimal player diversity and correlation management, we recommend building 3-4 distinct GPP lineups. Each lineup should vary the anchor pair and tier assignments to maximize your exposure to different tournament outcomes.
How to Construct Each Lineup
Select 2-3 anchors from the Premium Tier. Fill the remaining roster spots with exactly one player from each of 4 distinct tiers. Each tier should be used only once per lineup. The total salary must fall between $49,000 and $50,000. Use the Tier Salary column to estimate fit.
Example Lineup
Starting with Scottie Scheffler ($14,000) and Ludvig Aberg ($9,800) as anchors uses $23,800 of the $50,000 cap, leaving $26,200 for four tier selections. Tiers 11, 12, 13, and 14 combine for $26,200 in tier salaries, bringing the total to $50,000.
| Anchor 1 | Anchor 2 | Tier 11 | Tier 12 | Tier 13 | Tier 14 |
|---|---|---|---|---|---|
| Scottie Scheffler $14,000 | Ludvig Aberg $9,800 | Nicolas Echavarria $6,700 | Max Greyserman $6,600 | Nick Taylor $6,500 | Andrew Novak $6,400 |
| Michael Kim $6,700 | Casey Jarvis $6,600 | Matthew McCarty $6,500 | Kristoffer Reitan $6,300 | ||
| Rasmus Neergaard-Petersen $6,700 | Brian Harman $6,500 | Sam Stevens $6,400 | Hao-Tong Li $6,300 | ||
| Carlos Ortiz $6,600 | Sami Valimaki $6,500 |
For example, selecting one player from each tier column: Scottie Scheffler, Ludvig Aberg, Nicolas Echavarria ($6,700), Max Greyserman ($6,600), Nick Taylor ($6,500), and Andrew Novak ($6,400) totals $50,000. Adjust within each tier to hit the $49,000-$50,000 target.
Cash Game Strategy: High-Floor Core Lineup
Cash game strategy inverts the GPP approach. Instead of seeking differentiation and upside, cash games reward consistency and floor. The optimal cash lineup maximizes the probability that all six players make the cut and post respectable scores. High ownership is a feature in cash, not a liability.
The core lineup was calculated by filtering to only players with 75% cut probability, then running a brute-force optimization to find the 6-player combination that maximizes total combined ownership within the $49,000-$50,000 salary constraint. With 41 players at 75%+ cut probability in this elite field, the optimization pool is larger than typical full-field events.
| Player | Salary | Own% | Cut % | Proj Pts | 12X Pts/$ | Wave | Core |
|---|---|---|---|---|---|---|---|
| Scottie Scheffler | $14,000 | 24.73% | 95% | 102.0 | 0.22% | PM | |
| Jon Rahm | $10,000 | 21.92% | 95% | 99.0 | 18.19% | PM | ✓ |
| Bryson DeChambeau | $10,200 | 21.02% | 85% | 96.0 | 12.05% | AM | |
| Ludvig Aberg | $9,800 | 18.30% | 78% | 91.0 | 12.09% | PM | |
| Rory McIlroy | $11,600 | 17.49% | 84% | 95.0 | 2.65% | AM | |
| Chris Gotterup | $8,000 | 17.23% | 75% | 83.0 | 27.56% | PM | ✓ |
| Sepp Straka | $8,000 | 16.71% | 75% | 79.0 | 22.49% | PM | ✓ |
| Nicolai Hojgaard | $7,500 | 15.81% | 75% | 78.0 | 30.42% | AM | ✓ |
| Min Woo Lee | $7,700 | 15.62% | 75% | 87.0 | 40.06% | AM | ✓ |
| Russell Henley | $7,900 | 15.17% | 75% | 86.0 | 34.86% | AM | ✓ |
| Xander Schauffele | $9,600 | 14.88% | 82% | 94.0 | 17.64% | AM | |
| Matt Fitzpatrick | $8,700 | 14.70% | 78% | 91.0 | 27.71% | AM | |
| Brooks Koepka | $8,500 | 13.96% | 75% | 83.0 | 19.54% | PM | |
| Tommy Fleetwood | $9,300 | 13.77% | 80% | 92.0 | 19.82% | AM | |
| Cameron Young | $9,200 | 13.70% | 77% | 90.0 | 18.30% | AM | |
| Hideki Matsuyama | $8,900 | 13.60% | 77% | 90.0 | 22.96% | AM | |
| Jake Knapp | $7,400 | 13.42% | 75% | 79.0 | 33.09% | AM | |
| Jordan Spieth | $8,400 | 13.32% | 75% | 84.0 | 22.97% | PM | |
| Patrick Reed | $9,000 | 12.92% | 75% | 84.0 | 13.99% | AM | |
| Shane Lowry | $8,200 | 11.99% | 75% | 81.0 | 21.31% | AM | |
| Robert MacIntyre | $8,600 | 11.97% | 75% | 87.0 | 23.03% | PM | |
| Collin Morikawa | $9,500 | 11.96% | 75% | 89.0 | 13.43% | AM | |
| Tyrrell Hatton | $8,100 | 11.37% | 75% | 78.0 | 18.11% | AM | |
| Akshay Bhatia | $7,800 | 11.35% | 75% | 82.0 | 29.24% | AM | |
| Si Woo Kim | $7,800 | 11.06% | 75% | 85.0 | 35.05% | PM | |
| Corey Conners | $7,700 | 10.49% | 75% | 78.0 | 25.48% | AM | |
| Jacob Bridgeman | $7,400 | 10.37% | 75% | 78.0 | 31.85% | AM | |
| Viktor Hovland | $8,800 | 9.56% | 75% | 82.0 | 14.49% | AM | |
| Justin Thomas | $8,300 | 9.41% | 75% | 79.0 | 17.34% | PM | |
| Justin Rose | $9,100 | 8.74% | 75% | 84.0 | 12.48% | PM | |
| Sungjae Im | $7,500 | 7.96% | 75% | 75.0 | 24.93% | AM | |
| Maverick McNealy | $7,200 | 6.51% | 75% | 79.0 | 36.26% | AM | |
| Adam Scott | $7,200 | 5.93% | 75% | 81.0 | 40.79% | AM | |
| Daniel Berger | $7,100 | 5.34% | 75% | 75.0 | 31.43% | AM | |
| Patrick Cantlay | $7,900 | 5.26% | 75% | 81.0 | 27.42% | AM | |
| Kurt Kitayama | $6,800 | 4.41% | 75% | 78.0 | 43.19% | AM | |
| Sam Burns | $7,400 | 4.37% | 75% | 79.0 | 33.22% | AM | |
| Jason Day | $7,600 | 4.17% | 75% | 81.0 | 31.62% | AM | |
| J.J. Spaun | $7,200 | 3.79% | 75% | 79.0 | 35.84% | AM | |
| Harris English | $7,300 | 1.51% | 75% | 77.0 | 31.16% | PM | |
| Ben Griffin | $7,600 | 0.81% | 75% | 76.0 | 23.64% | PM |